


BA MEDIA & INTERACTION DESIGN
Elena Biasi – Magnetic Fragments
with Pauline Saglio, Christophe Guignard, Laura Nieder, Alain Bellet, Gaël Hugo, Lara Défayes
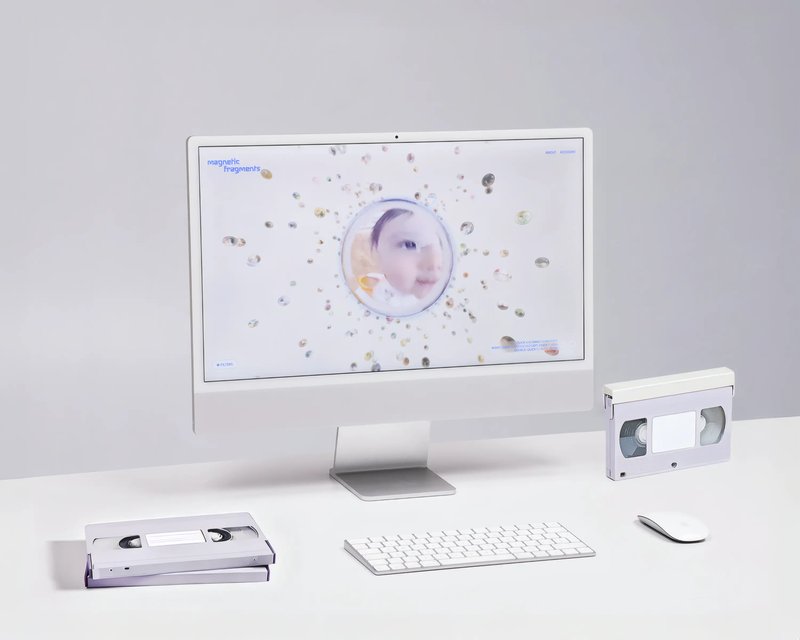
Before the rise of digital technology and social networks, everyday moments were captured on analog media and watched with family in one uninterrupted flow. These long VHS tapes, composed of successive sequences, gradually disappeared, victims of their obsolescence. Magnetic Fragments offers a way to rediscover these forgotten memories through a three-dimensional web interface, where each bubble represents a memory to explore and comment on. Designed for a private circle, the collaborative platform allows free navigation, revisiting each memory fragments in a dynamic way and breaking with the monotonous structure of past viewings. Magnetic Fragments thus becomes a space for intergenerational transmission, where the past is shared in the present.