MA DIGITAL EXPERIENCE DESIGN
RE-STRUCTURE
with RNDR STUDIO
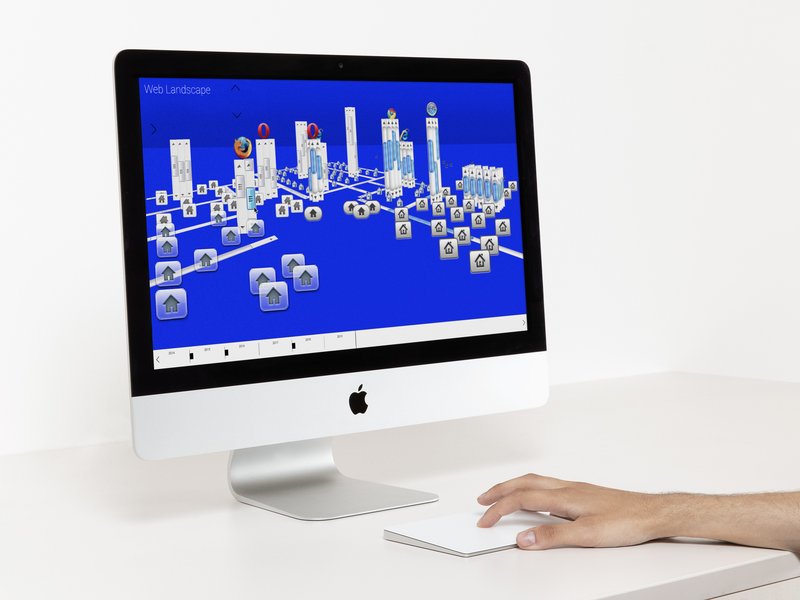
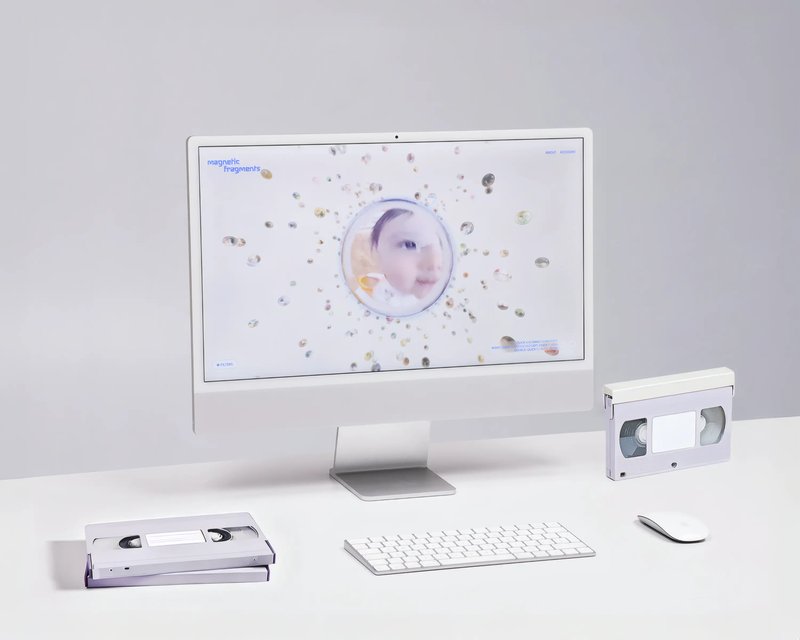
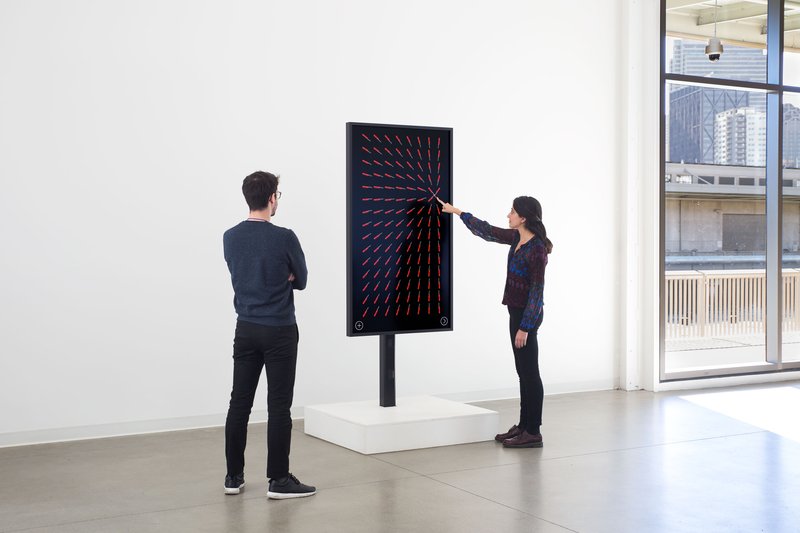
During this one-week workshop, Master Digital Experience Design students used machine learning tools to decompose music videos into their constituent parts: segmented scenes, detected gestures, extracted colors, analyzed beats, separated audio stems, transforming linear audiovisual artifacts into structured datasets. These components were then reimagined as interactive, non-linear systems: explorable maps, generative timelines, rhythm-driven interfaces, and self-recomposing structures built with the OPENRNDR framework.